
After another week of MLS action, our Power Rankings model has broken down every team's performance and pulled all the data to show how your club has performed.
A slight tweak in the way our OPI model calculates form was also rolled out.
The OPI model
Our power rankings are solely created by a data-based model we've pretentiously labeled "the Overall Performance Index" (OPI). This new model includes the same factors as the prior edition (points per game, strength of schedule, goal difference, and expected goal difference), while adding several other factors to provide a more rounded picture.
During the World Cup break, we made a slight tweak to the way that Previously, every point earned counted the same whether it came in Matchday 1 or Matchday 25. A hot start could sit at full value all season even if a team completely collapsed since.
Now, points decay in value the further back they were earned: a result from the start of the year carries about 15% as much weight by season's end as one from the current week. On top of that, the OPI still tracks the last five games separately for an extra emphasis on the very latest form.
Teams get real credit for early-season strength, but they'll start to drop if their active form begins to crater. And teams climbing the table get recognized faster, too.
 Ben Wright
We've built a really cool Power Rankings app that updates in real time and lets you explore the data. It also has an in-depth explainer of the methodology we use. We're continuing to build out some of the coolest interactive data apps in independent soccer media, and we hope you'll follow along with us!
Matchday 25 Power Rankings
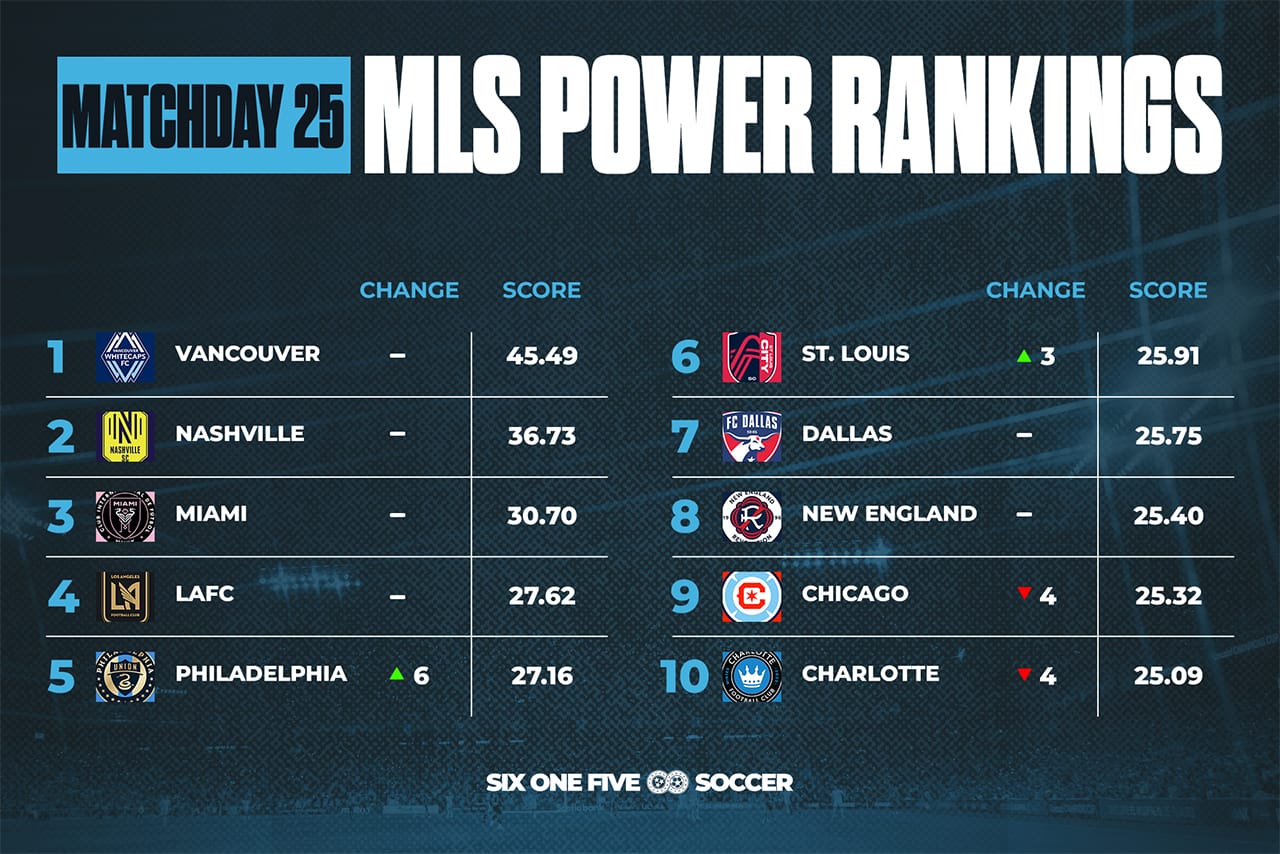
Vancouver Whitecaps maintain the top spot, even after a tough loss to Austin FC on Sunday night. The 'Caps have put up some historical underlying numbers this season, and with a three-point lead over Houston Dynamo in the West, they're a favorite of the OPI model.
Houston, despite being in second in the West, don't even crack the top 10 in our model. Their form over the last five matches is the ninth-worst in the league, as well as their poor underlying numbers, are holding them back.
Similarly, Nashville SC are in second place in the OPI model by a significant margin, despite a nine-point lead on top of the table. They've heavily underperformed their underlying numbers (+28.4 against their expected goal differential), which dings their score significantly. This has them in second, despite a 2.19 weighted points per game that is completely on its own, and 2.00 points per game in their last five.
Interestingly with Nashville, the model gives them the easiest remaining strength of schedule in MLS, which could be a major factor in their hunt to get 21 points from their remaining nine matches and break the single-season points record.
Weekly winner
The Philadelphia Union smashed San Diego FC 5-0 on the road, extending their winning streak to four in a row and continuing the best form in MLS. Despite an awful start to the year, the tweak to the model has their weighted points per game at 1.69, the eighth-best in MLS, while their goals added metric is fourth in the league. They look like a real problem in the playoffs.
Philadelphia jumped up six spots in this weekend's rankings, improving their score by 4.61 points.
Weekly loser
San Diego FC got clapped at home, which will always decrease any team's score. Their goal differential dropped to zero, while their expected goal differential is in the negative. Their form has continued to struggle after the World Cup break, resulting in a 3.76 decrease in score and dropping two places in the rankings.